If there was one word for 2020, it very well might be “uncertainty” — rarely a positive noun in the investment world. Global pandemic aside, a presidential election is traditionally a time for some uncertainty among investors to the degree they believe a president’s party or policies can shift the market.

However, data suggests that degree of influence an election result has on the market is not always so clear. There have been 17 presidential elections since 1950, and each comes with unique variables that may impact market performance. Collecting and organizing the data from these elections is made easier using YCharts, a leading research firm for financial advisors based in Chicago, IL. “YCharts allows Ballast Advisors to collect historical data, like election data, export it to an Excel spreadsheet for analysis and detecting trends, and present it in a way that is easy to digest for clients,” says Steve Schmidt, a partner at Ballast Advisors. Schmidt makes it clear that the data and graphs from YCharts are meant to provide context, not as investment advice. Past performance should never be used to indicate future results.
“We often hear from our clients during an election cycle,” says Schmidt. “They often have concerns about the impact of an election on their financial plans.” While every investor is different, Steve Schmidt and the professionals at Ballast Advisors have taken the time to answer three common questions heard from investors during this election
How differently do markets perform when a Democrat or Republican candidate is leading in major polls?
According to trends observed in the data from YCharts, when presidential candidates are “tied” in polling, the S&P 500 daily and cumulative returns are negative. On average, the trends in the YCharts data reveals the market tends to favor a Republican candidate leading the major polls.
“Keep in mind, leads in political polls often vary depending on the source of the poll,” said Schmidt, “polls are not an exact science, and may also have inherit bias depending on the targeted participants of the poll.”
S&P 500 Performance By Party Leading Polls 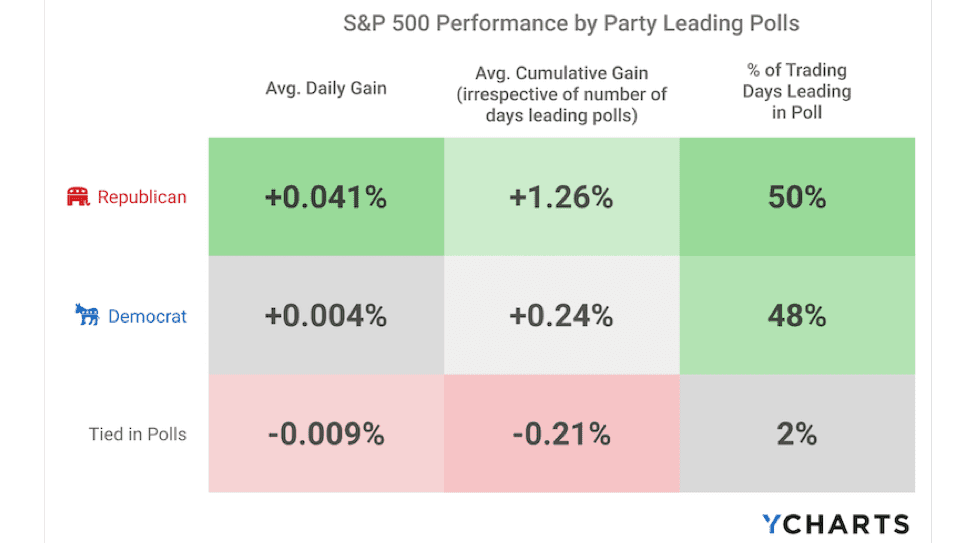
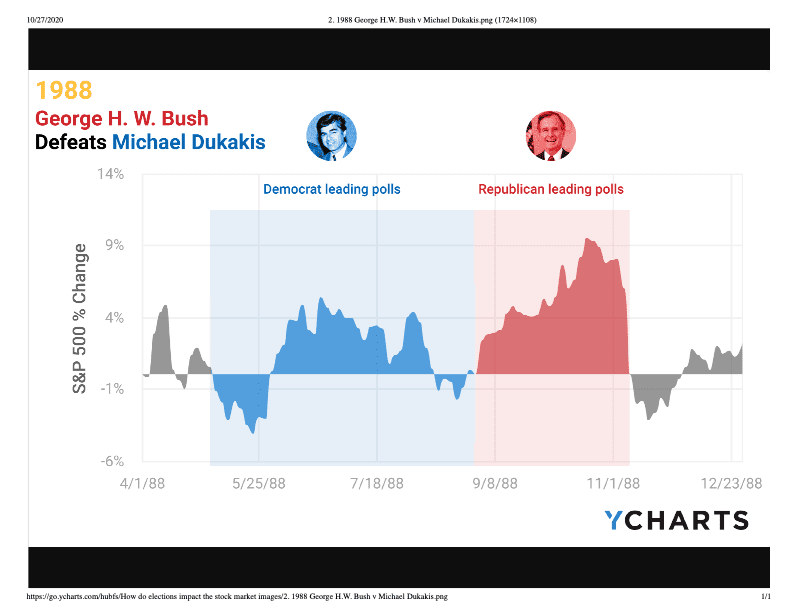
Two strong examples of this pattern: S&P 500 percent change under poll leaders in the 1988 and 2000 U.S. Presidential elections. See disclosures below.

Does the market react differently when a Republican or Democrat candidate is elected?
Although, historically the market may initially react favorably to a Republican candidate because of the belief that their policies are more “Business friendly” and therefore more stock-market favorable versus Democrat candidates. However, data demonstrates that once a president takes office, in the long run the market has performed better under Democratic presidents on average.
“Today’s economic conditions and thus, market performance, is often a cumulative effect that can be a decade in the making,” Schmidt says. “Today’s economy often stems from the work of both current and previous administrations combined.”

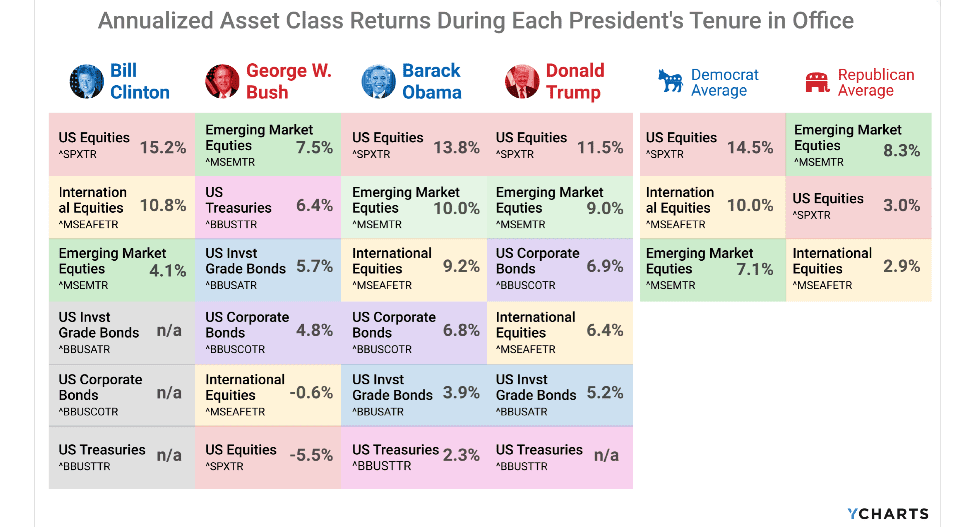
How have other major asset classes performed under recent presidents?
According to YChart data, U.S. and Emerging Market Equities have been among the best performing major asset classes since Bill Clinton’s 1993 inauguration. In the last 30 years under four different presidents, U.S. and International Equities handily outperformed under Democrats, and Emerging markets have slightly outperformed under the Republican presidents (Performance through Set 14, 2020 for Donald Trump).
“At the end of the day,” Schmidt reminds us, “markets fluctuate for a host of reasons, many of which are misunderstood by seasoned investors. The best laid investment plan is to stay diversified.”
Summary – What does this mean for you?
What does this mean overall? If you’re basing your investment decisions on what party is or isn’t elected during presidential elections, you’re likely hurting your portfolio more than helping it. The person occupying the White House is just one of many variables that impact investment values. For example, the Dot.com burst in 2001, and the financial crisis in 2008 greatly impacted the markets beyond the control of Presidents Bush and President Obama.
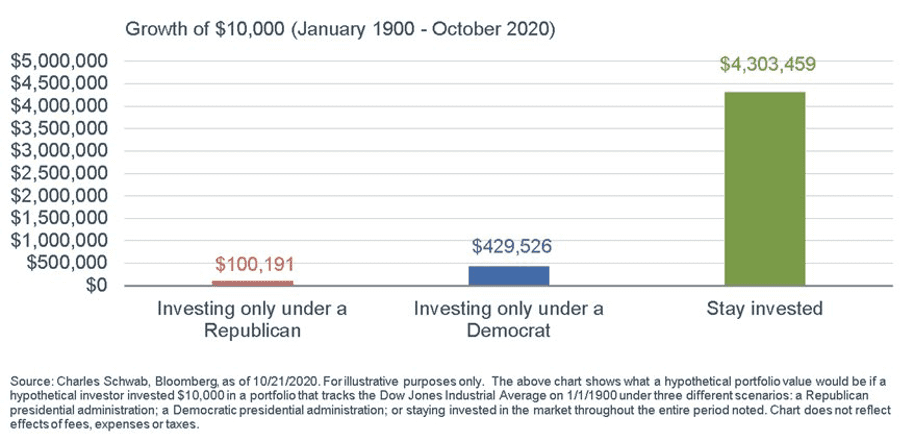
“At Ballast Advisors, we recommend in the face of uncertainty clients ‘stay invested,’ because almost without exception we’ve accounted for money needed in the near-term,” Schmidt reminds us. Prominent investor Peter Lynch once said, “Far more money has been lost by investors preparing for corrections, or trying to anticipate corrections, than has been lost in corrections themselves.” According the chart below, the S&P500 has consistently grown in value, no matter who is in office.
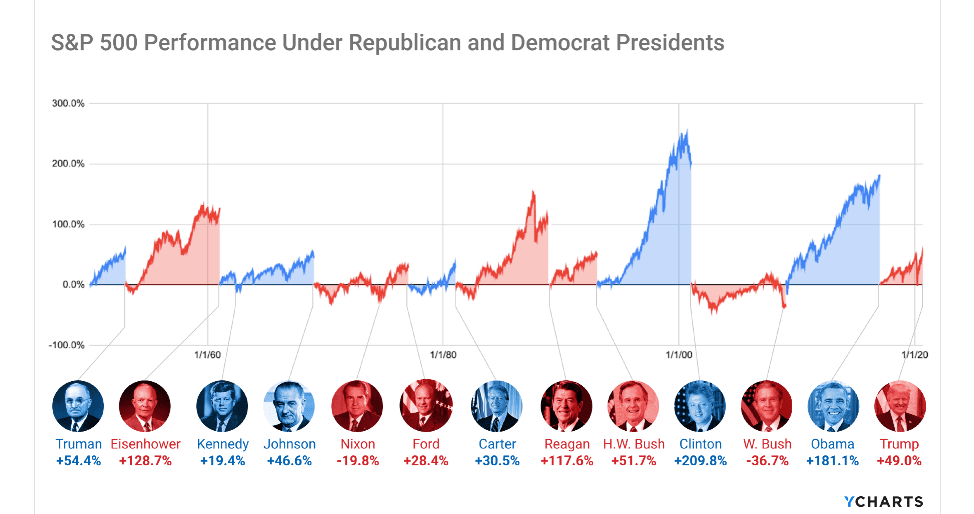
Rather than invest in stocks under only a Republican or Democratic president, stay invested in stocks for the long-term under all presidents.
Data & Disclaimers
The opinions expressed herein are those of Ballast Advisors, LLC and are subject to change without notice. The third-party material presented is derived from sources Ballast Advisors consider to be reliable, but the accuracy and completeness cannot be guaranteed. Ballast Advisors, LLC is a registered investment advisor under the Investment Advisers Act of 1940, as amended. Registration does not imply a certain level of skill or training. Past performance is no guarantee of future results. All investing involves some degree of risk. Nothing contained herein is an offer to buy or sell a security, investment strategy or product. More information about the firm, including its services, strategies, and fees can be found in our ADV Part 2, which is available without charge upon request.
Historical market performance for the S&P 500 and other asset classes accessed via https://go.ycharts.com/hubfs/Guide_to_How_Presidential_Elections_Impact_the_Stock_Market.pdf
Presidential term dates can be found https://en.wikipedia.org/wiki/List_of_presidents_of_the_United_States
Polling sources: 1952-2012 elections: Gallup; 2016-2020 elections: Marist College, Monmouth University, Siena College/The New York Times Upshot, ABC News/The Washington Post ( A+ rated pollsters FiveThirtyEight). How this polling data works: https://projects.fivethirtyeight.com/pollster-ratings/ How this polling data works: Pollster data sourced from FiveThirty Eight and is good through May 19, 2020. FiveThirtyEight’s pollster ratings are calculated by analyzing the historical accuracy of each firm’s polls along with its methodology. Accuracy scores are adjusted for the type of election polled, the poll’s sample size, the performance of other polls surveying the same race, and other factors. FiveThirtyEight also calculates measures of statistical bias in the polls.
Data was aggregated by YCharts with the end-date of each poll’s collection period serving as the charted poll date.
©2020 YCharts, Inc. All Rights Reserved. YCharts, Inc. (“YCharts”) is not registered with the U.S. Securities and Exchange Commission (or with the securities regulatory authority or body of any state or any other jurisdiction) as an investment adviser, broker-dealer or in any other capacity, and does not purport to provide investment advice or make investment recommendations. This report has been generated through application of the analytical tools and data provided through ycharts.com and is intended solely to assist you or your investment or other adviser(s) in conducting investment research. You should not construe this report as an offer to buy or sell, as a solicitation of an offer to buy or sell, or as a recommendation to buy, sell, hold or trade, any security or other financial instrument. For further information regarding your use of this report, please go to: ycharts.com/about/disclosure
The S&P 500 index is an unmanaged market-capitalization-weighted index of 500 common stocks chosen for market size, liquidity, and industry group representation to represent U.S. equity performance. The index is provided for comparative and informational purposes only. It is not possible to invest directly in the index shown.